R.N. Elliott noted that a parallel trend channel typically marks the upper and lower boundaries of an impulse wave, often with dramatic precision. You should draw one as early as possible to assist in determining targets.
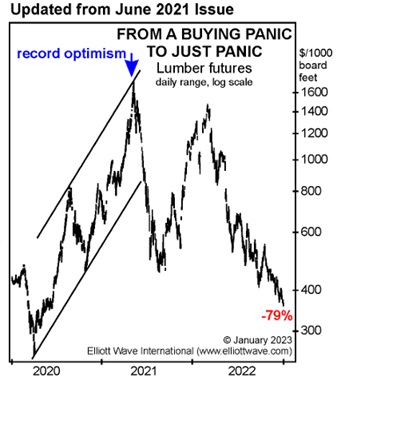
Here’s an example of how we used a trend channel in real-time. In our June 2021 Elliott Wave Financial Forecast, we said, “The chart [below] of lumber prices shows that since April 2020, lumber surged 589%. The final run-up looks suspiciously like a buying panic. Notice that prices peaked the exact day they met the top line of the trend channel formed by the rally from 2020”:
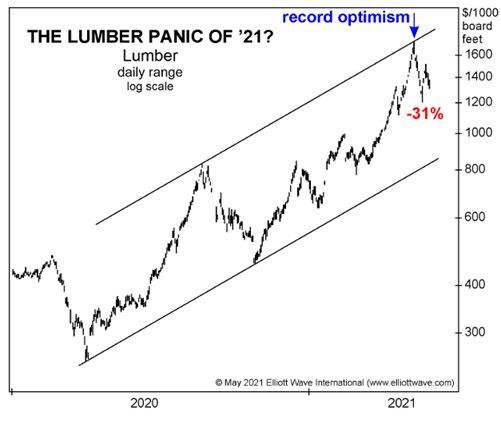
When lumber’s price hit that top line, many investors were extremely bullish. The 5-day DSI sentiment indicator (trade-futures.com) was at 96% — about as lopsided a reading as you can get.
Fast forward to January 2023. Our Elliott Wave Financial Forecast provided the updated chart below and said, “The decline brought lumber futures prices down 79% into December 20.”
You’ll often find discussions of trend channels – and many other useful tools – featured in our monthly Elliott Wave Financial Forecast.
Or, learn more about trend channels and other Elliott wave patterns and terms with our Waveopedia Index.