Promotional Videos & Articles
Browse our latest promotional videos & articles.
-

How Leverage Can Turn Wins Into Wipeouts
Huge gains. Then a total wipeout. See how overconfidence and lack of a method can quickly turn success into disaster.
-
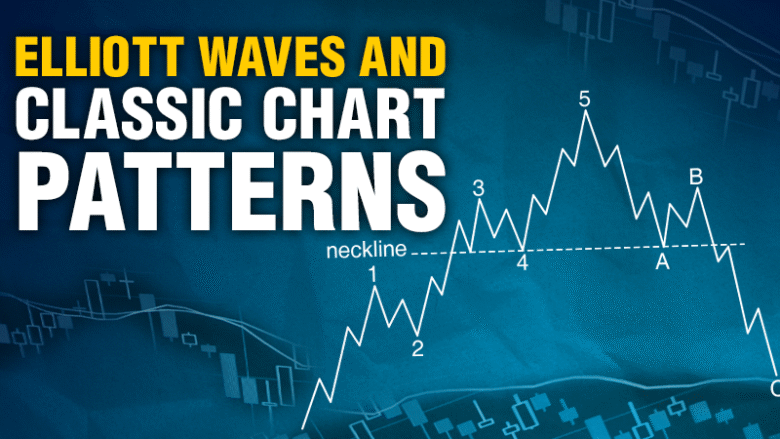
Elliott Waves Subsume Classic Technical Chart Patterns
The Wave Principle can consolidate technical analysis under a single model. Consider our example of the classic head-and-shoulders chart formation.
-
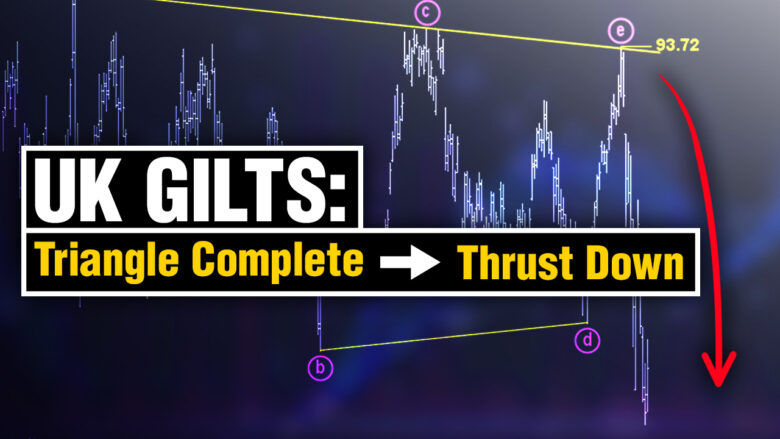
UK Gilts Topped Near Key Resistance — Then the Triangle Thrust Hit
Before gilts dropped sharply, a clear Elliott wave pattern was forming. See how our analyst identified a bearish triangle in UK gilts — and the key resistance level where a sharp decline was likely to begin.
-
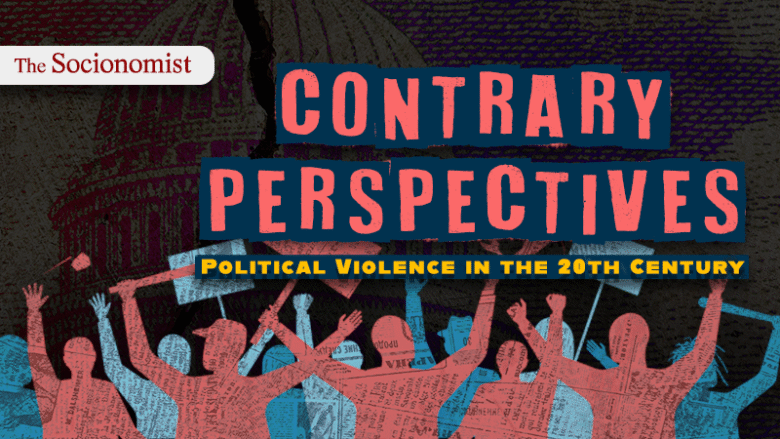
20th Century Political Violence: Where it All Began
What does the U.S. of today have in common with the country, at the turn of the 20th century? The short answer: Violent and deadly political clashes. The new, April Socionomist has the story in full.
-

The Bull Market Has No Clothes?
How do you pick “best dressed” when the nominees aren’t wearing any clothes? That was the challenge of commentators at the 2025-6 red-carpet awards shows.
-

How Flash Services Identify Market Opportunities — Powered by EWAVES
See how our Flash Services identify developing market setups and deliver real-time alerts with defined levels — including a recent +35% combined move in March.
-
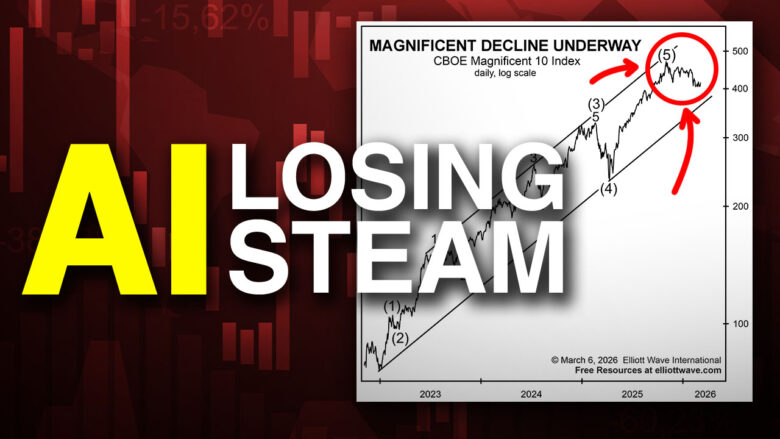
The Magnificent 10 Breakdown
The AI-driven “Magnificent 10” may be losing momentum after a powerful run. See what this means for the “Tech Bear.”
-
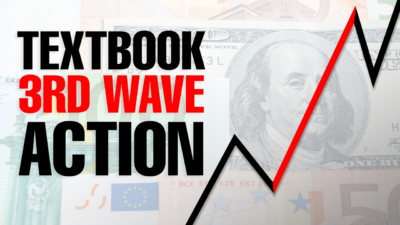
EUR/USD — See What a Third-of-a-Third Wave Looks Like
A textbook third-of-a-third wave sent EUR/USD soaring in 2025. Discover how this powerful Elliott wave pattern helped anticipate the move in advance.
-

Emaciated Nation
From the red carpet to the fashion runway, celebrity bodies are now… skeletal chic? Yes, it’s as disturbing as it sounds.
-

Macro Warning Signs Across Stocks, Bonds and Private Credit
In this series of clips, see how weakening tech leadership, stock-market divergences, rising government interest costs and stress in private credit are forming macro warning signs that could shape global markets in the months ahead.
-
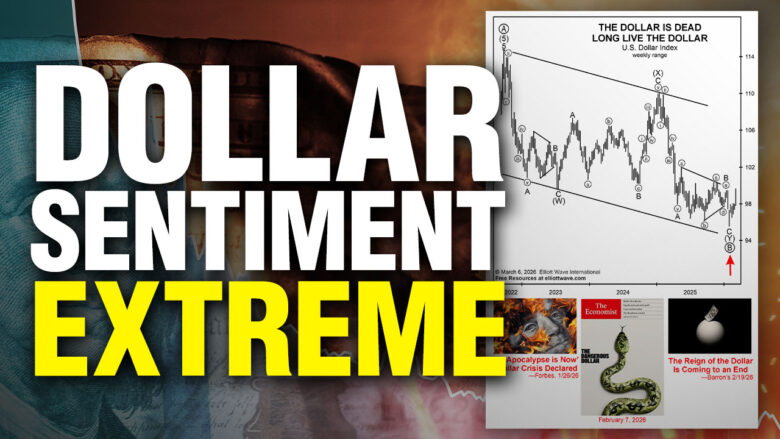
The “Dollar Apocalypse” Counter-Trade
“Dollar apocalypse” headlines have continued. Here’s what this extreme sentiment may be signaling.
-
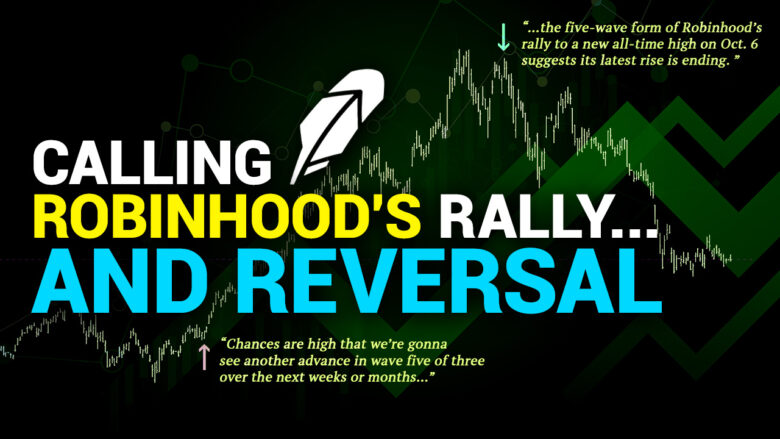
Here’s How We Called Robinhood’s Rally — and its Reversal
Robinhood’s powerful rally — and its sharp reversal — didn’t catch EWI by surprise. See how our analysts used Elliott wave analysis to identify the bullish setup, then warned when the advance was likely nearing completion.
-
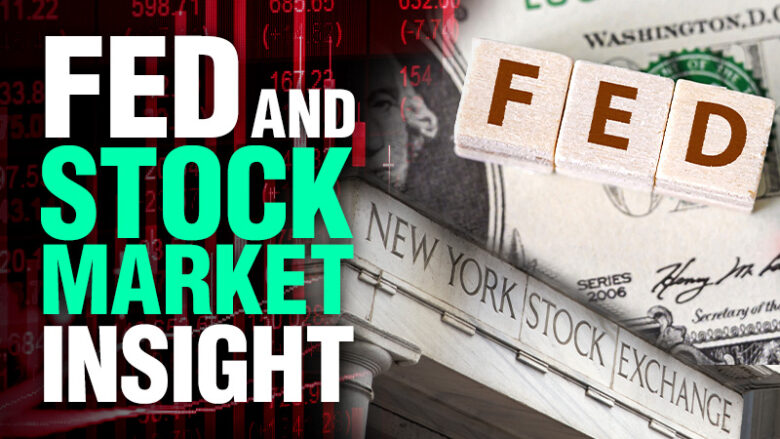
The Irrelevance of Fed Shocks
Investors often await Fed meetings with bated breath. They’re eager to know what the Fed will say next. But does it really matter to the stock market? Here’s a key insight.
-
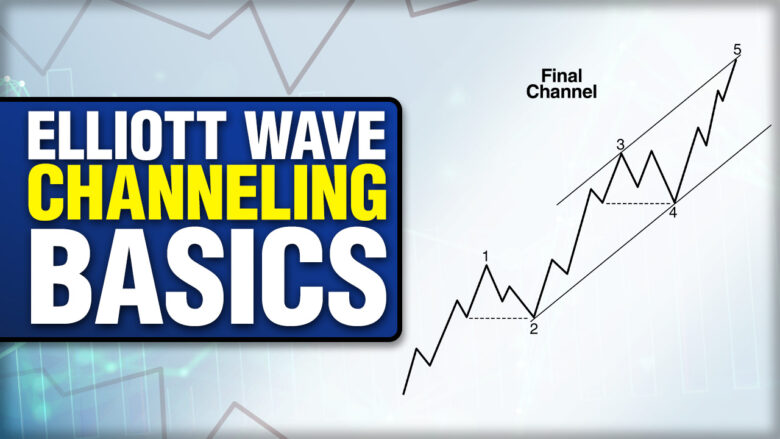
How to Use Elliott Wave Channels in Your Analysis
R. N. Elliott noted that a parallel trend channel typically marks the upper and lower boundaries of an impulse wave, often with dramatic precision. See how to apply this technique to your analysis.
-

You Don’t Have to Pick the Exact Bottom — An Elliott Wave Lesson
In this clip, our Trader’s Classroom instructor shows why waiting for confirmation can be more effective than trying to pick exact market turning points. See how Elliott waves can help recognize opportunities and manage risk.
-

How Elliott Waves Unfold from Generation to Generation
How can the investor psychology of decades ago be linked to now? A description of what occurred in the aftermath of a college football game provides insight.
-
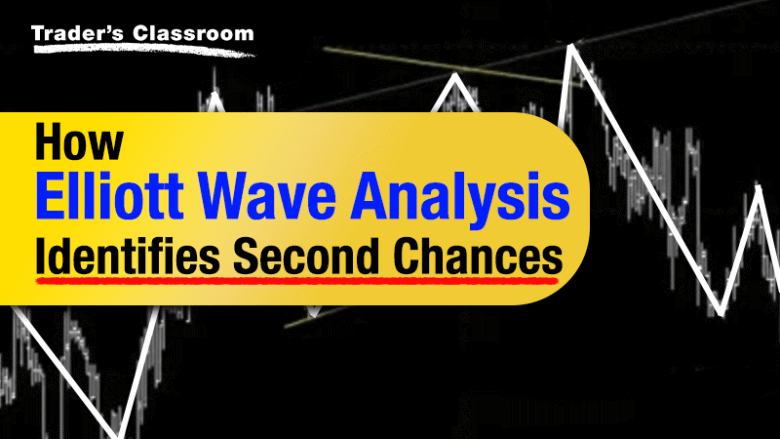
How Elliott Wave Analysis Identifies Second Chances
Markets often offer more than one opportunity — if you know what to look for. In this clip, see how Elliott wave analysis helps you recognize setbacks that may offer a second opportunity to join trends.
-

Walking for Peace. Again, and again and…
When the Buddhist monks walking for peace reached their destination on Jan. 10, something remarkable happened. Ordinary people grabbed the baton.
-
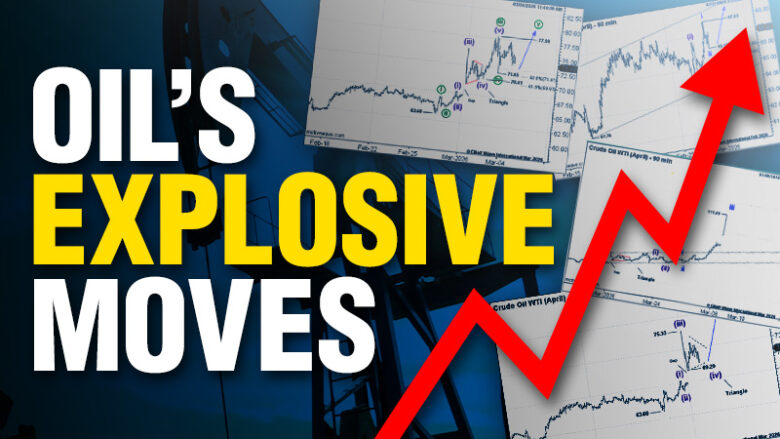
How Energy Pro Service Subscribers Stayed Ahead of Crude Oil Volatility
A series of forecasts from EWI’s Energy Pro Service from February 27th-March 8th equipped subscribers for the coming, volatile near-term moves in the crude oil market. They were ready. See the charts and forecasts right now.
-
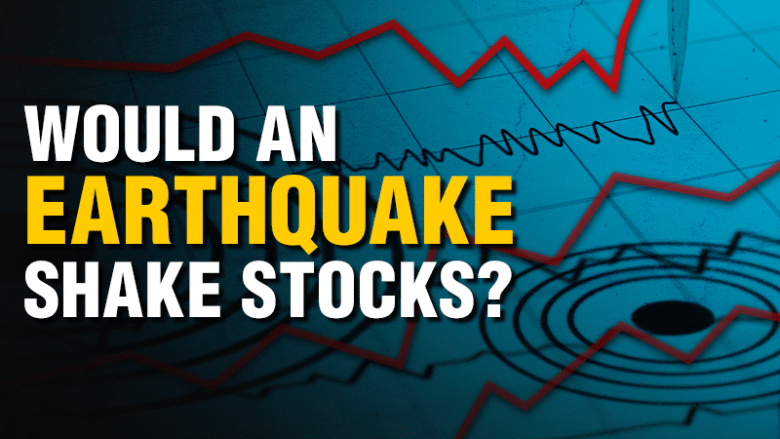
Find the Earthquake on This Stock Chart
Many investors believe that a devastating natural disaster would send a nation’s stock market into a tailspin. But history shows that such a shock had only a short-term effect on equity prices. See if you can identify on a market chart when a major earthquake devastated a country in South America.
-
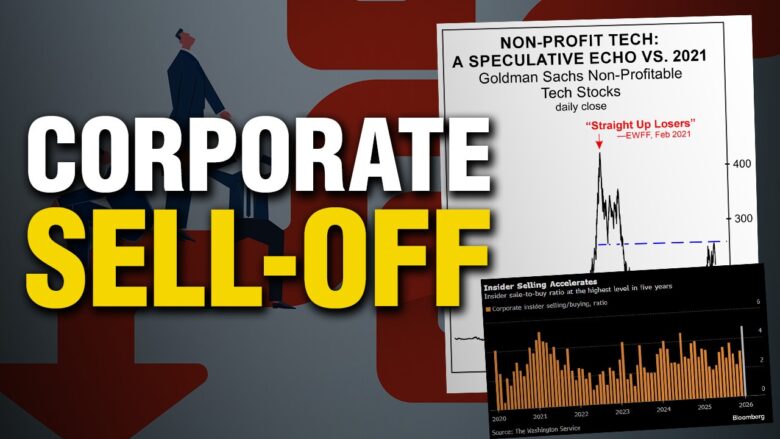
Insiders Are Sprinting for the Exit
Insiders are selling at the fastest pace in five years. Nearly five are exiting for every one buying. Here’s why that’s a red flag.
-

The Girl Scouts & Ganja!
Make way for the most unlikely partnership of 2026 thus far: the Girl Scouts of America and… a weed dispensary. We couldn’t make this stuff up if we tried.
-
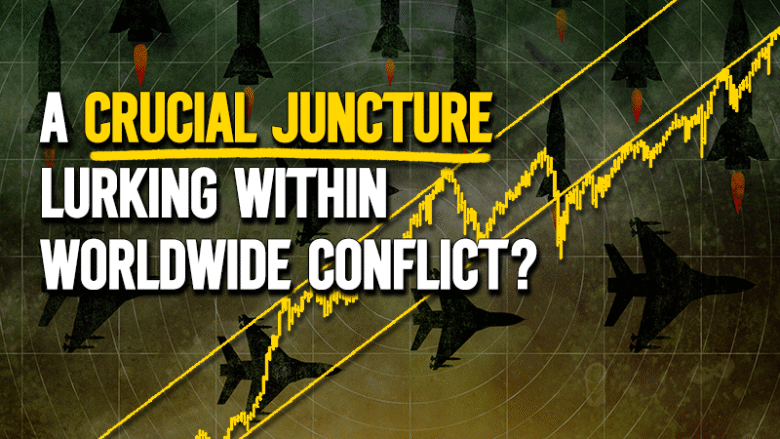
A Crucial Juncture Lurking Within Worldwide Conflict?
When global chaos breaks out, the right hand-picked chart can offer investors clarity – and opportunity. That’s exactly what EWI’s Mark Galasiewski offers via a five-plus decade chart of the MSCI World Index.
-
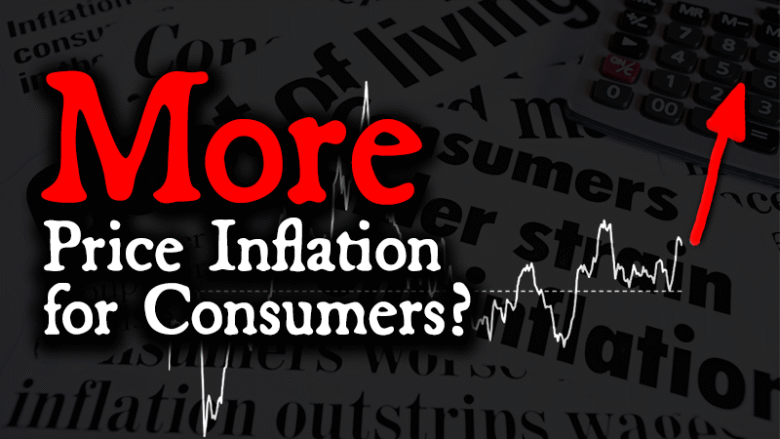
More Price Inflation for Consumers?
That’s the question EWI’s Murray Gunn helps answer, with a Treasuries chart of 5-year minus 10-year breakeven percentage – a proven indicator of inflation expectations. Murray also puts the chart in the context of EWI’s commodity forecast.
-
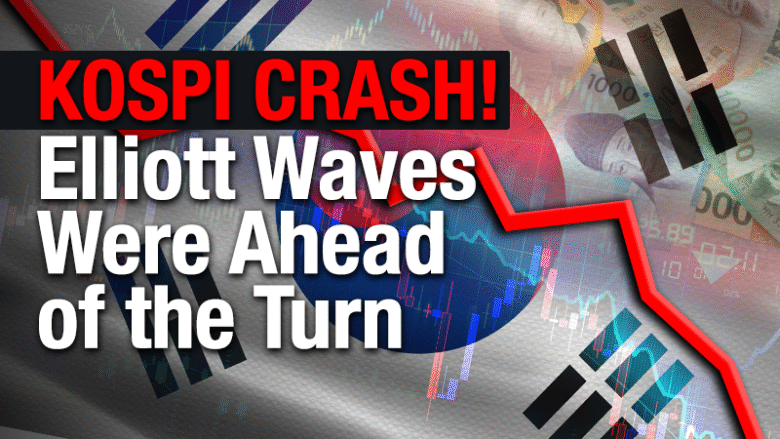
KOSPI Crash – Elliott Waves Were Ahead of the Turn
South Korea’s KOSPI 200 plunged 12% in a dramatic selloff — but Elliott waves had already warned the parabolic rally was nearing exhaustion. See how our analysis identified a major turning point days before the crash.
-

The Idea that Peace and War Drive Stock Prices Is a Myth
Does an event as momentous as war affect the trend of the stock market? Most people think so. But the data don’t back it up.
-

A.I. Under Fire
If you hadn’t heard of Anthropic or its A.I. model, Claude, you have now! It just stood up to the U.S. Pentagon to insist all machine learning technology is used to protect – and not harm – innocent Americans.
-
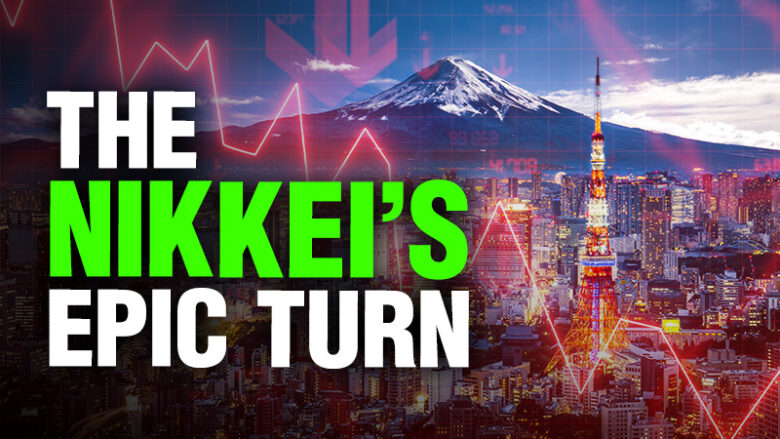
Epic Decline, As Forecast: Japan’s Nikkei in 1989
In 1989, the world was convinced Japan’s financial dominance would last forever. We saw something different. See how our Elliott wave forecast anticipated the Nikkei’s epic 75% collapse — and what we’re tracking now.
-
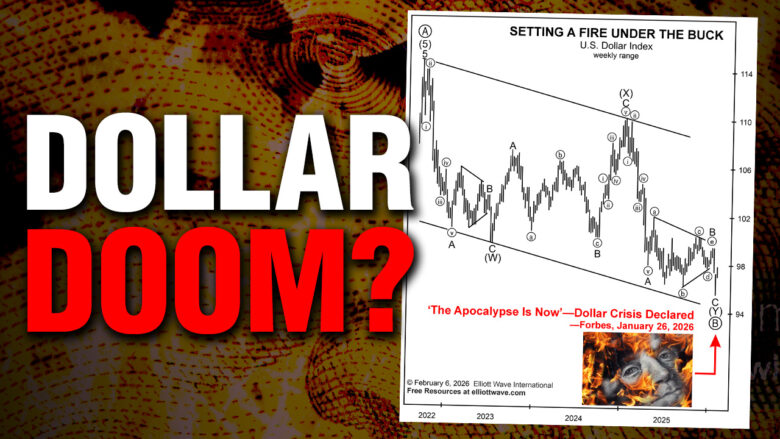
The Dollar Apocalypse?
Headlines are calling for the end of the dollar — but extreme sentiment often marks major turning points.
-

Mexico in Chaos After “El Mencho” Killing
The Mexican cartel rampage continues following the killing of the country’s most powerful drug kingpin. Read our completely unconsidered take on why today!