Traditional technical-analysis chart patterns fit within the broader framework of the Elliott wave model.
Elliott waves subsume head and shoulders tops and bottoms, rounding tops and bottoms, triangles, rectangles, double and triple tops and bottoms, diamonds, falling and rising wedges, pennants and flags.
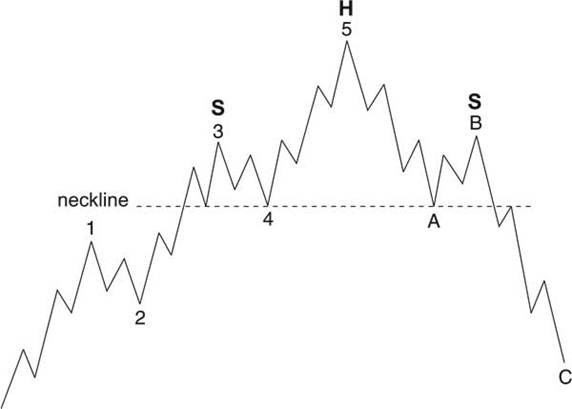
Let’s take just one example: the head and shoulders top. The excerpt below, from Elliott Wave Principle, shows how it fits within the Wave Principle:
In a normal wave development, wave five of 3 and wave 4 form the “left shoulder” of the pattern, wave 5 and wave A form the “head,” and wave B and wave one of C form the “right shoulder.” Wave two of C creates the return to the neckline that is typical of the pattern (below).
So, if you’re a fan of traditional technical chart patterns, the Wave Principle can consolidate them under a single model and help you determine which formations are most likely of real significance.
To learn more about Elliott wave analysis, read the online version of the definitive text on the topic, Elliott Wave Principle: Key to Market Behavior. It’s free.
Or, discover what our latest Elliott wave analysis suggests is ahead for the stock market — subscribe now.