I’m not a big geopolitics guy, so for me the Venezuela/Maduro thing is just another news item. But I DO pay attention to market prices, and I couldn’t get crude at like $55/barrel out of my head. Then, eureka! It hit me.
19 years ago this month, crude oil bottomed in the $50s – and then rallied nearly $100/barrel over the next year and a half.
Check out this forecast from my Elliott wave guys back then:
Global Market Perspective, January 31, 2007 (Published 10 trading days after the low):
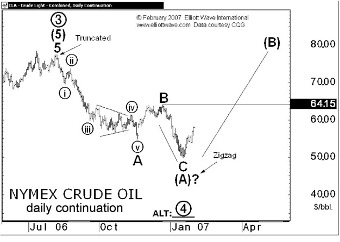
“Crude extended its sell-off from last summer’s record high to a 19-month low and reversed…. The three-wave structure from the top fits my outlook for a corrective decline. Given the depth of the decline (i.e., >38.2% retracement of the wave 3 advance), a strong alternate is that wave 4 is complete.”
What happened next:
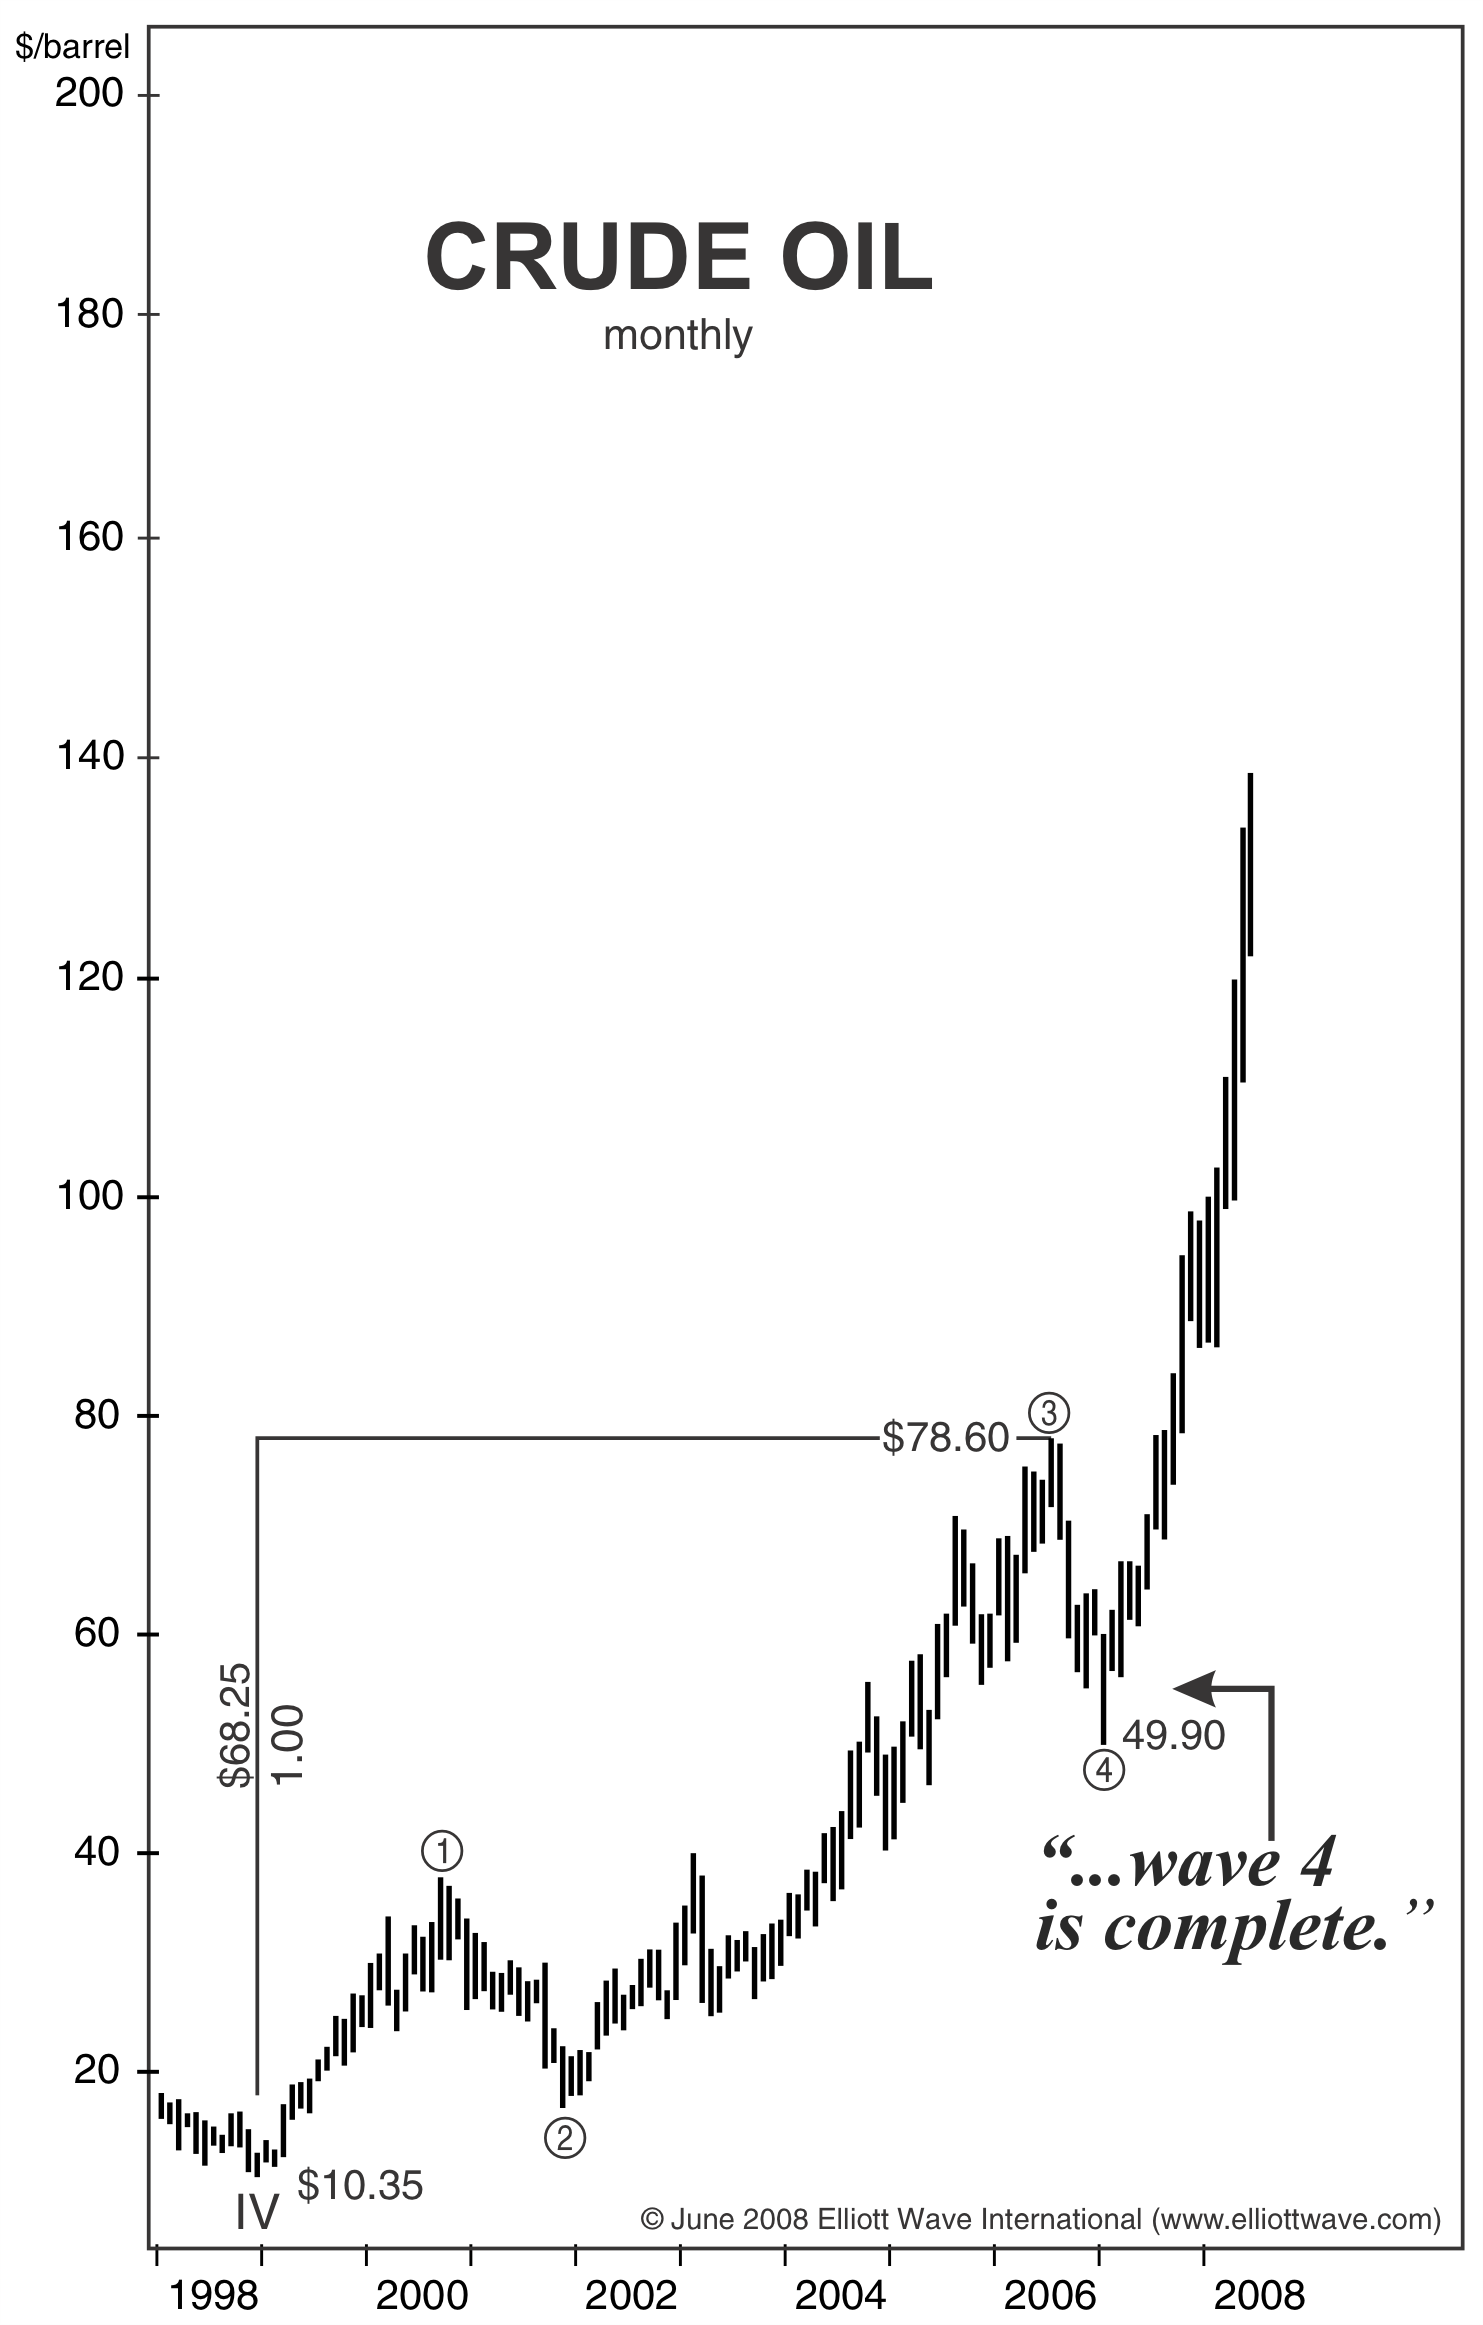
To be clear, this historical example is not a forecast. This is just one example of how Elliott wave analysis has helped subscribers stay ahead of major swings in crude oil.
If you want to see how this approach has worked across multiple oil cycles — and how it’s being applied to current price action — there are two ways to explore further…
See what the Elliott waves are signaling now:

 Energy Pro Services
Get daily and intraday Elliott wave analysis of crude and energy markets.

 Global Market Perspective
Get a monthly overview of energy along with 50+ other global markets.
No headline forecasting. Just structure, psychology, and price — applied in real time.
OR
Read the FREE Energy Market Highlights Report:

A curated collection of real, time-stamped crude-oil forecasts from the past 30+ years, covering major peaks, collapses, and reversals. Read it and decide for yourself: Would this input have helped you?